The most comprehensive data on Android Apps from Play Store you will find anywhere. This has been put together using unofficial non-commercial Play Store APIs and publicly available reports. I will try to update these data points every quarter.
There are just 0.075% Apps on Play Store with over 1mn installs + 4.5 star ratings

[5th August] Number of Apps on Play Store has now come down to 3.2mn. Lot of fake & inactive apps were weeded out by Google recently
Top 10 Developers on Play Store

Paid vs Free Apps Share
Just 2 years ago, Paid Apps share was 15%. It will continue to slide further as developers & consumers prefer Freemium over paid

[5th August] Share of paid Apps has fallen further. It now has 5% share overall. Paid Apps count has fallen to 150k now while Free Apps are at 2.9mn
Top Categories by number of Apps (Free)
Interestingly Shopping, Dating, Social aren’t popular among developers. Reason = few top apps almost have monopolistic control over these categories

Top Categories by number of Apps (Paid)
There are just 220k paid Apps on Play Store and less than 2000 apps have crossed a million mark

Top Apps based on MAUs

Average Cost per Install Worldwide

Monthly App Downloads — Android only
Last 12 months saw 60 billion Installs on Play Store. China alone did 67 billion Android installs

Monthly Consumer Spends In-App
Worldwide consumers spent $14.6 billion in last 12 months excluding China. Chinese consumers spent $13.2 billion in-App 😯

Minutes Spent on Apps per day in each country

Top Countries based on App Used vs Installed

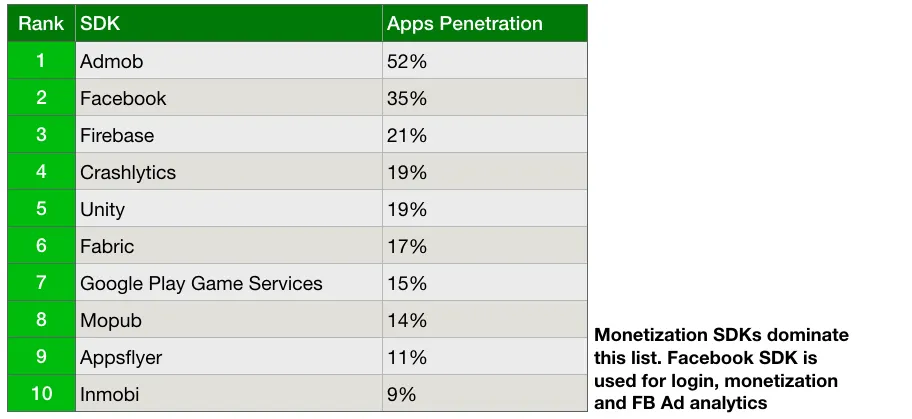
Most Popular SDKs embedded in Apps

I will be happy to hear your feedback on this. Let me know if you would like me to add any more data points here. Feel free to comment here or tag me on twitter @deepakabbot or mail me at dabbot@gmail.com
Get Deepak Abbot’s stories in your inbox
Note: This data may have a 15% error rate. Refer this data for getting a macro trend around Android Apps


