Growth maths · Free
Retention Curve Calculator
Plot D1 / D7 / D30 retention against benchmarks.
D1 retention
32.0%
Benchmark ~30% · above
D7 retention
14.0%
Benchmark ~12% · above
D30 retention
7.0%
Benchmark ~6% · above
Solid line: your cohort. Dashed: typical consumer app benchmark.
How to use it
- Enter the size of a cohort and how many were active on each day.
- Compare each point with the benchmark line.
What good looks like
- Typical consumer apps: D1 ~25–35%, D7 ~10–15%, D30 ~5–8%.
- A curve that flattens means you have a retained core.
Related reading
Android
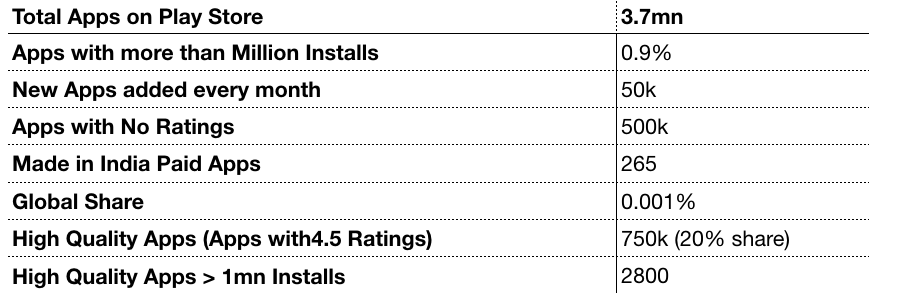
Google Play Store Data: 3.7mn Apps, $14.6bn spends, 60bn Installs, Top Categories, CPI Worldwide and over 100 data points
Google Play Store Data: 3.7mn Apps, $14.6bn spends, 60bn Installs, Top Categories, CPI Worldwide and over 100 data points The most comprehensive data on Android Apps from Play Store you will find …
Deepak Abbot · Aug 5, 2018 · 2 min read

Mobile
Retentioneering 101: Track & Retain your App installs
Retentioneering 101: Track & Retain your App installs By now, most growth practitioners do not talk about App installs. The key metric have changed from Installs to Visitors to Active. First step to …
Deepak Abbot · Feb 17, 2018 · 3 min read
![App Growth Metrics: eCPI, CAC, True LTV, Retention, Cost of MAU/DAU Calculator for Beginners [Download Excel]](https://miro.medium.com/v2/resize:fit:1200/1*vnvxHGioGbevnOh1KZSvsA.jpeg)
Mobile
App Growth Metrics: eCPI, CAC, True LTV, Retention, Cost of MAU/DAU Calculator for Beginners [Download Excel]
App Growth Metrics: eCPI, CAC, True LTV, Retention, Cost of MAU/DAU Calculator for Beginners [Download Excel] I keep stressing upon the fact about using the “Right Metrics” in all my growth …
Deepak Abbot · Jun 7, 2016 · 2 min read